Welcome to my very first english article!
I currently manage « only » 3 PRESEARCH nodes but I could manage all PRESEARCH nodes because I’m a system administrator using tools like puppet and debian since many years.
I will NOT show you how to install prometheus or grafana. I will suppose that it’s already done but I will show you the things to do.
First : put the node name inside the description field on presearch website.
Prometheus node
You need to install a prometheus node exporter :
Prometheus node exporter can be installed on a different node that Prometheus server or Grafana server.
You can read the documentation : https://prometheus.io/docs/guides/node-exporter/
After it’s installed, you must check it is working by doing this :
systemctl status node_exporter
The output will display :
					● node_exporter.service - Prometheus node_exporter
     Loaded: loaded (/etc/systemd/system/node_exporter.service; enabled; vendor preset: enabled)
     Active: active (running) since Wed 2022-08-24 03:03:32 CEST; 5 days ago
   Main PID: 568 (node_exporter)
      Tasks: 7 (limit: 9509)
     Memory: 34.3M
        CPU: 13min 51.798s
     CGroup: /system.slice/node_exporter.service
             └─568 /usr/local/bin/node_exporter --collector.textfile.directory=/var/lib/prometheus-node_exporter
If not, check the startup file /etc/systemd/system/node_exporter.service :
					# THIS FILE IS MANAGED BY PUPPET
[Unit]
Description=Prometheus node_exporter
Wants=network-online.target
After=network-online.target

[Service]
User=node-exporter
Group=node-exporter

ExecStart=/usr/local/bin/node_exporter \
--collector.textfile.directory=/var/lib/prometheus-node_exporter

ExecReload=/bin/kill -HUP $MAINPID
KillMode=process
Restart=always

[Install]
WantedBy=multi-user.target
The directory /var/lib/prometheus-node_exporter is important and will contains PRESEARCH datas!
BASH script to retrieve PRESEARCH data
Usually, I do scripts with python but this time, it will be with BASH.
WARNING : this script is a template, you need to replace 3 variables :
- Replace <%= @presearch_api_key %> by your PRESEARCH API Key
- Replace <%= @presearch_api_url %> by PRESEARCH API URL (https://nodes.presearch.com/api)
- Replace <%= @collector_path %> by collector_path (/var/lib/prometheus-node_exporter/)
You need to install the “jq” package : apt install jq
Script path to create : /root/bin/presearch_report.sh (or /usr/local/bin/presearch_report.sh):
					#!/bin/bash

API_KEY="<%= @presearch_api_key %>"
API_URL="<%= @presearch_api_url %>"
statminok=(0 15 30 45)
DATEM=`date +%M`
startdate=''
checkstat=0
if [[ " ${statminok[@]} " =~ " ${DATEM} " ]]; then
    checkstat=1
    DATES=`date -u --date='-15 minutes' +'%F %H:%M'`
    startdate="&start_date=${DATES}"
fi
STATS=`curl -s -H "Accept:application/json" "$API_URL/nodes/status/$API_KEY?stats=${checkstat}${startdate}"`

# STATUS
COLLECTOR_FILE=<%= @collector_path %>`hostname -f`.presearch-status.prom
tmpfile=$(mktemp <%= @collector_path %>.XXXXXX)

echo '# HELP presearch_status PRESEARCH Status' >> $tmpfile
echo '# TYPE presearch_status gauge' >> $tmpfile
echo '# Old metrics' >> $tmpfile
echo '# New metrics' >> $tmpfile

# status
# 0 : Disconnected
# 1 : Connected

echo $STATS | jq -c '[.nodes[] | {host: .meta.description, gateway: .meta.gateway_pool, version: .meta.version, connected: .status.connected, avg_uptime_score: .period.avg_uptime_score, avg_latency_score: .period.avg_latency_score, avg_success_rate_score: .period.avg_success_rate_score, avg_reliability_score: .period.avg_reliability_score, total_pre_earned: .period.total_pre_earned, rewardable_requests: .period.rewardable_requests}] | sort_by(.host) | .[]' | while read json; do
        host=$(echo $json | jq -r .host)
        gateway=$(echo $json | jq -r .gateway)
        version=$(echo $json | jq -r .version)
        status=0
        connected=$(echo $json | jq -r .connected)
        case ${connected} in
            false)
                status=0
            ;;
            true)
                if [ $gateway == "testnet"  ]; then
                    status=1
                else
                    status=2
                fi
            ;;
        esac
        echo "presearch_status{host=\"$host\",gateway=\"$gateway\",version=\"$version\"} $status" >> $tmpfile;
     done

# moving file
chmod go+r $tmpfile
mv $tmpfile $COLLECTOR_FILE

if [ $checkstat -eq 1 ]; then
    # REWARDS
    COLLECTOR_FILE=<%= @collector_path %>`hostname -f`.presearch-rewards.prom
    tmpfile=$(mktemp <%= @collector_path %>.XXXXXX)

    echo '# HELP presearch_rewards PRESEARCH Rewards' >> $tmpfile
    echo '# TYPE presearch_rewards gauge' >> $tmpfile
    echo '# Old metrics' >> $tmpfile
    echo '# New metrics' >> $tmpfile

    echo $STATS | jq -c '[.nodes[] | {host: .meta.description, gateway: .meta.gateway_pool, version: .meta.version, connected: .status.connected, avg_uptime_score: .period.avg_uptime_score, avg_latency_score: .period.avg_latency_score, avg_success_rate_score: .period.avg_success_rate_score, avg_reliability_score: .period.avg_reliability_score, total_pre_earned: .period.total_pre_earned, rewardable_requests: .period.rewardable_requests}] | sort_by(.host) | .[]' | while read json; do
            host=$(echo $json | jq -r .host)
            total_pre_earned=$(echo $json | jq -r .total_pre_earned)
            echo "presearch_rewards{host=\"$host\"} $total_pre_earned" >> $tmpfile;
        done

    # moving file
    chmod go+r $tmpfile
    mv $tmpfile $COLLECTOR_FILE

    # REQUEST
    COLLECTOR_FILE=<%= @collector_path %>`hostname -f`.presearch-requests.prom
    tmpfile=$(mktemp <%= @collector_path %>.XXXXXX)

    echo '# HELP presearch_requests PRESEARCH Requests' >> $tmpfile
    echo '# TYPE presearch_requests gauge' >> $tmpfile
    echo '# Old metrics' >> $tmpfile
    echo '# New metrics' >> $tmpfile

    echo $STATS | jq -c '[.nodes[] | {host: .meta.description, gateway: .meta.gateway_pool, version: .meta.version, connected: .status.connected, avg_uptime_score: .period.avg_uptime_score, avg_latency_score: .period.avg_latency_score, avg_success_rate_score: .period.avg_success_rate_score, avg_reliability_score: .period.avg_reliability_score, total_pre_earned: .period.total_pre_earned, rewardable_requests: .period.rewardable_requests}] | sort_by(.host) | .[]' | while read json; do
            host=$(echo $json | jq -r .host)
            rewardable_requests=$(echo $json | jq -r .rewardable_requests)
            echo "presearch_requests{host=\"$host\"} $rewardable_requests" >> $tmpfile;
        done

    # moving file
    chmod go+r $tmpfile
    mv $tmpfile $COLLECTOR_FILE
fi
After you execute the script by a CRON, I show you my CRON (script must be chmod 0755) :
crontab -l | grep pres
					# Puppet Name: presearch report
* * * * * /root/bin/presearch_report.sh > /dev/null 2>&1
The script will create 3 files that can be exported and downloaded by a prometheus server. I show you an example of what there is inside the files :
presearch-rewards.prom
cat /var/lib/prometheus-node_exporter/xxx.presearch-rewards.prom
					# HELP presearch_rewards PRESEARCH Rewards
# TYPE presearch_rewards gauge
# Old metrics
# New metrics
presearch_rewards{host="pre1gra2"} 0.05155565703190414
presearch_rewards{host="pre1sgp1-1"} 0.05412707128988071
presearch_rewards{host="pre1sgp1-2"} 0.010521657031904134
presearch-rewards.prom
cat /var/lib/prometheus-node_exporter/xxx.presearch-requests.prom
					# HELP presearch_requests PRESEARCH Requests
# TYPE presearch_requests gauge
# Old metrics
# New metrics
presearch_requests{host="pre1gra2"} 1
presearch_requests{host="pre1sgp1-1"} 1
presearch_requests{host="pre1sgp1-2"} 0
presearch-status.prom
cat /var/lib/prometheus-node_exporter/xxx.presearch-status.prom
					# HELP presearch_status PRESEARCH Status
# TYPE presearch_status gauge
# Old metrics
# New metrics
presearch_status{host="pre1gra2",gateway="eu-de-1",version="1.0.13"} 2
presearch_status{host="pre1sgp1-1",gateway="as-sg-1",version="1.0.13"} 2
presearch_status{host="pre1sgp1-2",gateway="as-sg-1",version="1.0.13"} 2
Grafana dashboard
You can donwload my JSON to import to your grafana by clicking here.
If it’s not working, here how to create the panel :
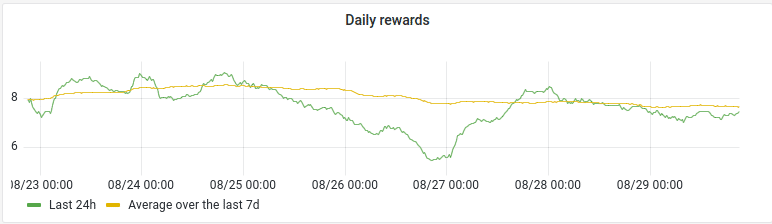
Daily rewards panel
- Visualisations : Time series
- Query options:
- Min interval: 15m
- Metric A :
- query patterns : sum(sum_over_time(presearch_rewards[24h])/60)
- Legend: Last 24h
- Metric B :
- query patterns :
sum(sum_over_time(presearch_rewards[7d])/60)/7 - Legend: Average over the last 7d
- query patterns :
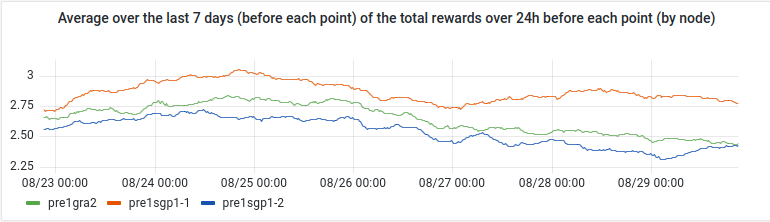
« Average over the last 7 days (before each point) of the total rewards over 24h before each point (by node)» panel
If you find how to write the title in good english, tell me 🙂
- Visualisations : Time series
- Query options:
- Min interval: 15m
- Metric A :
- query patterns : sum_over_time(presearch_rewards[7d])/60/7
- Legend: {{ instance }}
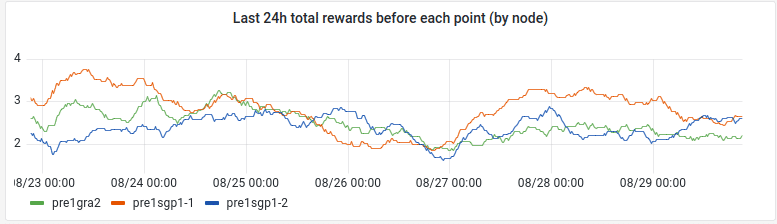
« Last 24h total rewards before each point (by node) » panel
- Visualisations : Time series
- Query options:
- Min interval: 15m
- Metric A :
- query patterns : sum_over_time(presearch_rewards[24h])/60
- Legend: {{ instance }}
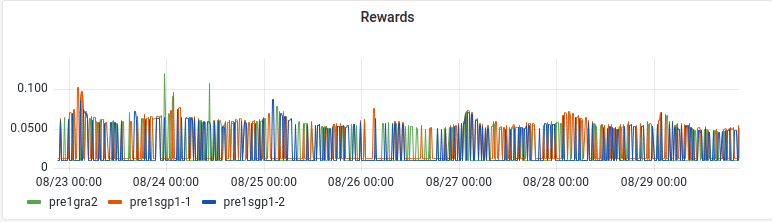
« Rewards » panel
- Visualisations : Time series
- Query options:
- Min interval: 15m
- Metric A :
- query patterns : presearch_rewards
- Legend: {{ instance }}
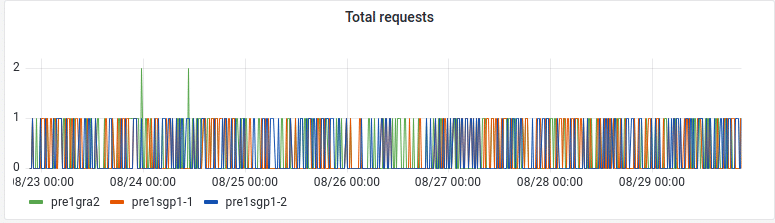
« Total requests » panel
- Visualisations : Time series
- Query options:
- Min interval: 15m
- Metric A :
- query patterns : presearch_requests
- Legend: {{ instance }}
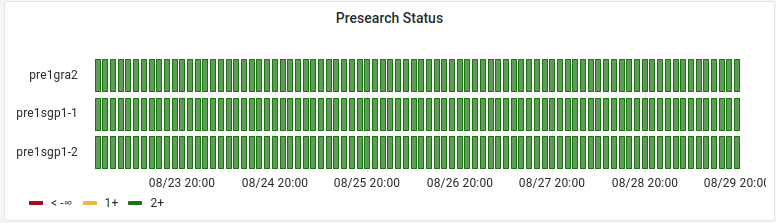
« Presearch Status » panel
- Visualisations : Stat
- Query options:
- Interval: 5m
- Metric A :
- query patterns : presearch_status
- Legend: {{ host }}
- Value mappings (on the right near bottom) (+Add threshold):
- 2 -> OK
- 1 -> Testnet
- 0 -> Disconnected
- Thresholds (on the right near bottom) (+Add threshold):
- Green = 2
- Orange = 1
- (red) = Base

« Presearch Status (again but different graph) » panel
- Visualisations : Status history
- Query options:
- Max data points: 200
- Min interval: 1m
- Interval: 2h
- Metric A :
- query patterns : sum(presearch_status) by (host)
- Legend: {{ host }}
- Thresholds (on the right near bottom) (+Add threshold):
- Green = 2
- Orange = 1
- (red) = Base
If you have difficulties, presearch how to do 🙂
If you have more difficulties, presearch more.